KEYWORDS
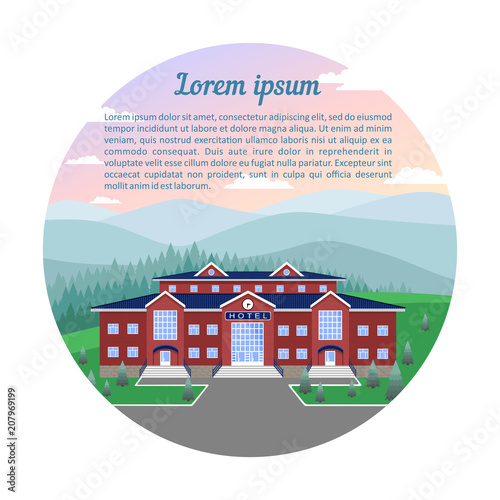
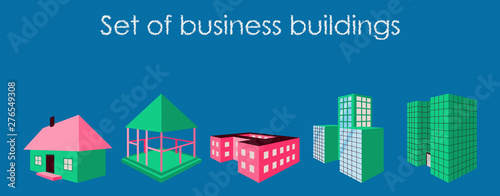
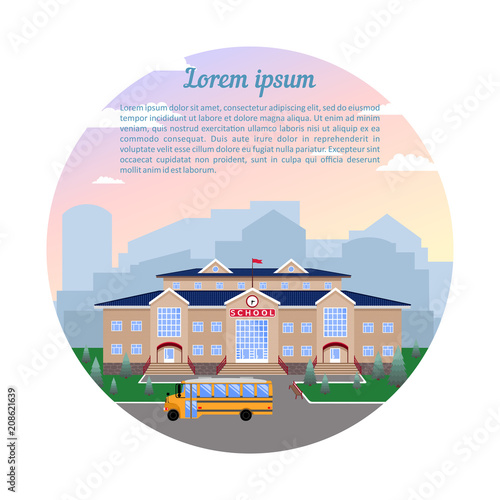
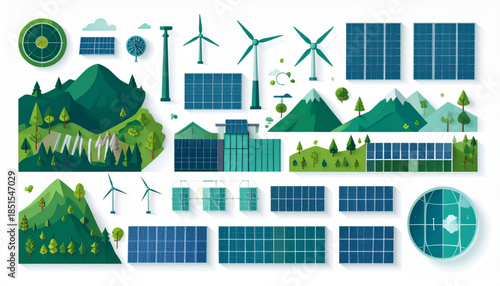
urbanization pie chart vector infographic paper art illustration paper cut city urban 3d graphic icon landscape road info element modern diagram skyline structure cityscape building nature town sign house home street tree symbol architecture deforestation forest green fir save banner ecology environment wood global woodland destruction timber spruce population increase decrease area

